Dominion Strategy Forum

Please login or register.

Login with username, password and session length

Show Posts

This section allows you to view all posts made by this member. Note that you can only see posts made in areas you currently have access to.

Topics - markus

Filter to certain boards:

Pages: [1]
1
Dominion General Discussion / Card Leaderboard
« on: March 24, 2020, 02:55:03 am »
In the absence of a Qvist card ranking this year, over at the Discord we had the idea for a different approach.

Vote
A small website for submitting pairwise card comparisons is here: https://sites.google.com/view/domrating
There is an optional field for your (user) name. You can always not answer a comparison and it will just not enter the results. You can also call cards similar and this will enter as a tie result. I'll leave it up to you to decide, whether to call it a tie or make one card better than the other. (For Hexes, the idea is to vote for the ones that hurt the most.)

Results
Leaderboards can be calculcated the same way as the leaderboard of players, where cards either win or tie against each other. The results are regularly updated and can be found here:
https://docs.google.com/spreadsheets/d/1CaVOd1pgAgmjJHXPM1tVMVnlJOLDZaq8BxjW4I1NI1E/edit#gid=0

Everybody can submit as much or as little as they want. (There could eventually be alternative leaderboard calculations using weighted or selected responses only.)

I used all the Qvist categories, making Ways a new one. This rating approach allows for pooling all cost categories. On the spreadsheet with the leaderboard, there is a column for the Qvist cost that you can use to filter to find the subset of $3-costs etc. ("temporary filter", you can also download the sheet)
Kingdom cards and Landscapes are not mixed (so far), but Events and Projects are pooled.

The idea is to have it up for some time to get an initial rating. Afterwards, I could leave it open for further submissions or (temporarily) shut it down - not sure what the best approach is. After some time and/or when new cards get added, there could be a boost to cards' uncertainty and a new communal effort to update ratings (similar to the yearly edition of Qvist rating). The advantage is that we could then start from the existing ratings to have closer match-ups from the start as well as better initial ratings.

Interpreting the results
The rating that each card gets follows similar Glicko rules as the Dominion Online leaderboard (rating = mu there).
This means that the difference of ratings between cards, indicates how often it is expected to win in a (hypothetical) match-up. If everyone agreed on the exact order of the cards, you'd expect to see big gaps between each card. Groups of cards that are closer together indicate the opinions vary or "similar" is used.
The formula is approximately: win_probability = 1/(1+exp(-(rating1-rating2)))
There are 3 columns that calculate this win probability of a card compared to the best, the median, and the worst card in the list.

phi is the uncertainty of the rating. It goes down with more submissions and it shows whether the rating difference between two cards is (statistically) significant. (You could add about +/- 2*phi to the rating to get a 95% confidence interval.)

2
Dominion General Discussion / Card Draw Statistics
« on: March 03, 2019, 03:36:46 pm »
I’ve used my database of logs since the release of Renaissance to calculate statistics on draw and discard. (21,000 games with either the worse player having mu>1.3 or the better player having mu>1.8)
I’m tracking each time a card enters and leaves the hand of a player. (Or is played from somewhere else as if it entered your hand and was played immediately – Vassal, Throne Rooms, Band of Misfits,... see my notes below.) The results can be found in my stats sheet.


First, I’ll have a general look at the boards. I can check how many cards are drawn during the course of a game: 125 cards per player. The winner draws 136 cards compared to the loser’s 115 cards. (For example, playing a Village draws 1 card.)
This number is generally higher on boards with cards that increase your hand-size and also on boards with cantrips (playing each draws 1 card). Minion and Shepherd games top the list with 143 cards per player. On the other hand, if there’s trashing available, you don’t need to draw as many cards to get the game to an end. Donate is at the bottom of the list with only 92 cards. Other cards that can make a game short like Rebuild, Butcher and Salt the Earth are also listed there.

Most of this draw comes from drawing your 5 new cards during clean-up (75 cards). That’s more or less 15 turns drawing 5 cards each. (The exception would be Outpost turns and situations in which the deck contains fewer than 5 cards.) This number is 3 cards higher for the winner (the winner is more likely to have more turns).
Therefore, anything that makes the game longer like attacks will show up with a higher number there. Mountebank with 88 cards and Knights with 86 cards top the list. Donate with 60 cards and Governor with 62 cards are at the other end.

Hence, we’re left with 50 cards that are drawn by playing cards (or buying stuff). Some of that will be cantrips and when you play a Laboratory, your handsize only increases by 1. Therefore, I’m calculating “net draw”. It takes out the cost of playing the card to your handsize as well as discarding (Cellar) or trashing (Chapel) other cards from hand. Playing a Laboratory provides 1 card net draw, playing a Smithy 2 cards, playing a Warehouse -1 card. Summing up over all those cards with a positive net draw, I end up with 14 cards per player (winner 18, loser 12).
Margrave and Wharf are topping the list now, while Donate is still at the bottom, but you’ll also find Grand Market down there.

The second part of the table are the stats for the specific cards. I’ll present the stats from the winner’s perspective, noting that the loser drawing less is naturally also a sign of getting less lucky and not just being less skilled.
First in columns M and N, there is the total draw provided by the cards. Cards will be at the top if they draw a lot and are used a lot. (Counting House draws a lot per play, but unfortunately you often just ignore it.) Shepherd, Stables and Sauna/Avanto are the top with a draw of around 30 cards for the winner, Laboratory is at 21 cards and the Smithy family around 10 cards.
This can be split up into drawing on play, duration (Den of Sin and Wharf at the top), and on gain or trash effects (Villa, Fortress, Den of Sin and Ghost Town at the top.)
Next, I can look into how all this draw is used in practice. Columns O and P have the “discard” of cards from hand caused by this card. That could be discarding, putting on top of your deck, and trashing other cards from your hand. It could happen because you play the card, gain the card, call the card from the reserve mat, bought some event, etc.
Sifters are at the top of the list with Dungeon discarding 22 cards. Strong trashers end up with 8-10 cards. This discard number is decomposed into discarding and trashing further right in the table as well for whatever card that might be interesting (Count trashes 3.9 cards and discards 3.1 cards).
Another discard component that can be found there, is how often the card is “dead” in your hand (discarded during the clean-up phase). Because you either can’t, don’t need or don’t want to play it during your turn – not a good use of your draw. At the top of this list is the junk that you begin the game with (9.4 cards for Estates and 8.3 for Shelters). Cards that you typically can and want to play are below 1 in general.
Note that the measure is a bit too nice to terminal draw cards because cards that you draw dead with Smithy other than Smithies will count as a dead card in their respective row. But then it’s also partly Village’s fault that you can’t play it with 0 Actions left.

This allows me to calculate the net draw provided by each card. It is the draw minus the discard minus the number of plays and minus the number of being “dead” in hand. So the cards at the top of the list are the ones that provide you with a larger handsize. And the cards at the bottom better be useful in some other dimension to be worth the handsize reduction. Wharf wins with +19 cards, followed by City Quarter and Scrying Pool with around +15 cards for the winner. City Quarter and Scrying Pool are interesting because the loser only draws 6 cards with it. Partly, that’s because they gain fewer copies, but part of it will also be good or bad luck in aligning them in the right way. At the bottom there is Copper with -34 cards of course, followed by Ambassador (-20) and Forager, Remake around -15 cards. Artificer is the lowest card that doesn’t trash with -12 cards.

Some cards also affect the opponent’s handsize in a positive or negative way. I’m having those numbers in the decomposition of draw and discard. Minion tops both of those lists with the winner discarding 11.7 cards and drawing 9.3 cards due to their opponent’s Minion play.
I can add that effect on the opponent’s handsize to arrive at my preferred measure of card draw: subtract the cards that the opponent draws from net draw and add the cards that the opponent discards. Then, a usual Council Room play provides you with +2 cards relative to your opponent and a Militia play that makes them discard from 5 to 3 cards counts as +1 card. (Discarding your bad cards to Militia is not as bad of course as drawing fewer cards of course. But this exercise is just about drawing and discarding cards. Drawing a Curse to hand due to your opponent’s Torturer is usually not good, either…)
With this measure in columns S and T, Wharf keeps its top spot, but Margrave gets close to it with +19 cards as well. Ghost Ship also jumps up from +4 cards to +11 cards here, while Lost City loses from +9 cards to +6 cards.
For further statistics, you can download the sheet and calculate them from the available numbers (e.g. cards drawn per play or per gain).

Notes:
The accounting exercise is that cards “drawn” equals cards “discarded” over the course of the game. There are some errors and omissions in the official log, woodcutter, and my code that I try to correct for. But some edge cases that I’m aware of and probably more that I’m not aware of are missed (e.g. gaining Ghost Town not to hand but top of deck with Armory).
I can check for each game and player how big the absolute difference between draw and discard is and I’m satisfied with it being only 0.07 cards on average per player and game. The worst boards in that sense include Plan or Innovation, because those uses are not logged, but the error is still below 0.3 cards per game. If you still see something that looks odd (yes, Horn of Plenty shouldn’t have 1/700 cards drawn on trash/gain) and significant, let me know.

The general rule is that I want to attribute the draw or discard to what ultimately caused it. For example, if you play a Workshop and gain a Ghost Town, the gain to hand is Ghost Town’s effect and not Workshop’s. If you trash a Rats, the card that you draw gets attributed to Rats and not the trasher. The exception are boons and hexes which do get added to the card that caused their receives.

Only stuff that happens to a player’s hand before and during their last turn counts. For example, if you Militia your opponent and end the game, their discard doesn’t count.

For most cards it should be obvious from the numbers what is what (for example, setting aside with Island counts as trashing as does returning with Ambassador).

Vassal, Summon, etc count as +1 card draw for whatever caused the other card to be played. For example Vassal finding a Village counts as 1 Vassal and 1 Village play, and 1 draw for Vassal and Village each. As a result, net draw is 0 (your hand size is the still the same). Similarly, Summon counts as 1 card duration draw if it plays the card on the next turn.
Throne Room family: if a Throne Room plays another card, Throne Room draws 1 card. (Think of it as Throne Room putting the played card into your hand and immediately playing it again.) Playing Throne Room – Village means: 1 Throne Room and 2 Villages played, 1 card drawn by Throne Room, 2 cards drawn by Villages. It all nets to 0 and indeed your handsize is the same afterwards.
With the same logic, King’s Court gets +2 cards, when it plays a card (King’s Court on Village nets 1 card).

Band of Misfits, Overlord, Necromancer: playing them also draws 1 card. Overlord as Village means 1 Overlord and 1 Village play, 1 card drawn by Overlord and 1 card drawn by Village for a net 0.
Inheritance gets the Necromancer treatment: playing an Estate inheriting Village counts as 1 Inheritance play and 1 Village play, Inheritance and Village each draw 1 card. So “Estate” in the list of cards is never played.

+card token: Pathfinding and Teacher get the cards drawn from the token that they placed as duration draw.

-card token: counts as -1 card draw (if eventually removed), making Raid, Relic and Borrow the only cards with negative contributions in the draw decomposition.

Outpost, Mission, Fleet: the extra turns are not attributed to the cards but would show up as more draw during clean-up for that player.

Clean-up, Expedition, Flag, River’s Gift: clean-up draw is the 5 (or 3 with Outpost) cards drawn during clean-up. The cards due to Expedition, Flag and River’s Gift show up as duration draw for Expedition, Flag Bearer and whatever led to River’s Gift.

Donate: checks whether the 5 cards that you draw afterwards are more or fewer than what you drew in the previous clean-up. Often that will result in a small discard when trashing down to fewer than 5 cards. If you only draw 4 cards after your next turn, it will show up as only 4 cards drawn in clean-up.

3
The Best + Cards (Top Half)

Comments for odd ranks are provided by lovestha, comments for even ranks by markus.

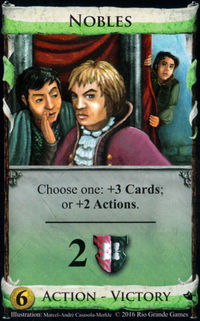
#19 ▲2 Nobles (Intrigue)
Weighted Average:
51.0%
Unweighted Average:
49.6%
Median:
48.7%
Standard Deviation:
16.6%

A very sad village, but still a village. A very sad source of VP, but still a source of VP. Only a little bit sad when it is how you are drawing cards, +3 cards is never bad. Getting all three in one package is very strong.
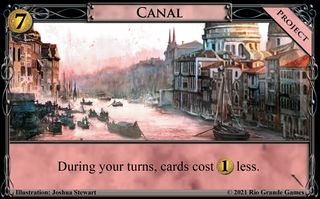
#18  Canal (Renaissance)
Weighted Average:
51.1%
Unweighted Average:
51.7%
Median:
48.7%
Standard Deviation:
21.0%

Being a project, you can't stack Canal as you love to do it with Bridges. The permanent cost reduction is still useful on the typical board and can be quite exciting with Workshops that suddenly can gain the shiny $5 cost cards.
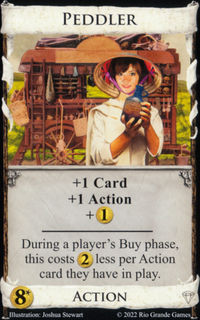
#17 ▲1 Peddler (Prosperity)
Weighted Average:
55.9%
Unweighted Average:
54.0%
Median:
54.1%
Standard Deviation:
18.6%

No better place to put surplus buys than a peddler. But for more than $2 it is a pretty sad option. Its position in the $6+ list is a bit awkward, has anyone ever paid $6 for Peddler when they cared about the text on Peddler?
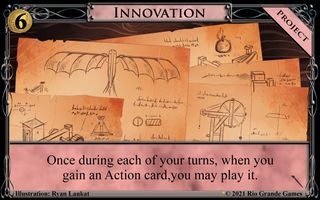
#16  Innovation (Renaissance)
Weighted Average:
57.6%
Unweighted Average:
57.6%
Median:
56.8%
Standard Deviation:
21.9%

The usefulness of Innovation depends on the board quite a bit. Preferably, there's a way to gain Action cards during the Action phase. Or there might be some cards that you can buy for a nice immediate effect. In contrast to other (expensive) projects, the only player to buy it doesn't have a great win performance in my stats sample (still ok!).
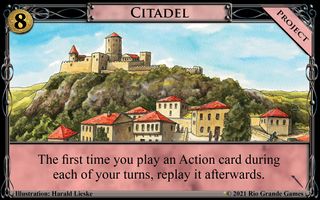
#15  Citadel (Renaissance)
Weighted Average:
61.3%
Unweighted Average:
63.3%
Median:
64.9%
Standard Deviation:
17.9%

The highest entry in this list of a Renaissance card. The reliability of a Throne Room every turn is great, having to play it first every turn is less awesome. Will not be surprised to see this rise a few slots next year.
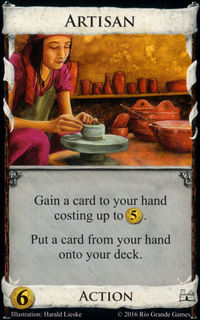
#14 ▼1 Artisan (Base)
Weighted Average:
62.2%
Unweighted Average:
59.5%
Median:
64.9%
Standard Deviation:
16.4%

Artisan is a very nice gainer of $5 cost cards. Just get it as early as possible and you'll typically do fine.
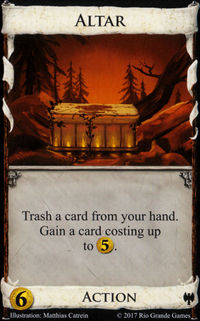
#13 ▲1 Altar (Dark Ages)
Weighted Average:
64.0%
Unweighted Average:
57.2%
Median:
59.5%
Standard Deviation:
19.6%

The big trash and gain. The gain is big enough that you aren't sad to sacrifice early purchases to it. I am a bit sad when it is the only trashing in a kingdom, it is so very slow at that it's nearly not worth mentioning, it is more a side benefit to use in the late game to get rid of early trashers after they are no longer useful or to keep up with a weak junker.
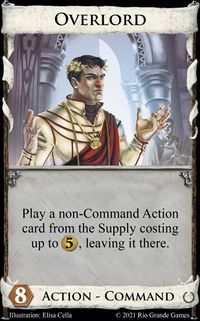
#12 ▼2 Overlord (Empires)
Weighted Average:
65.5%
Unweighted Average:
62.0%
Median:
62.2%
Standard Deviation:
20.2%

Getting Overlord on turn 2 to play your preferred $5 cost on turn 3 or 4 is often the correct move. Later on, buying the $5 costs might be cheaper, but possibly you value the higher reliability of Overlord. Just be careful, that the card you want to play doesn't pile out.
#11 ▼6 Fortune (Empires)
Weighted Average:
70.1%
Unweighted Average:
69.9%
Median:
73.0%
Standard Deviation:
20.3%

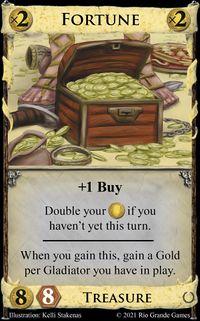
Biggest cost in the game, but it's worth it. May not be available is the biggest down side with it staying hidden under Gladiator many games.
#10 ▲2 Dominate (Empires)
Weighted Average:
70.7%
Unweighted Average:
69.3%
Median:
73.0%
Standard Deviation:
15.4%

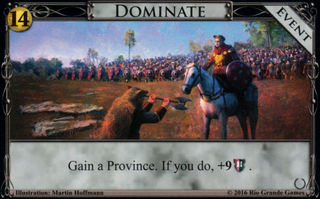
Dominate gains the 2 ranks that it lost last year to swap it's rank with Overlord again. It potentially provides a lot of VP, so you usually want to build a bit more...and then watch out for the 3-pile that ends the game before a Dominate gets even bought.
#9 ▲2 Grand Market (Prosperity)
Weighted Average:
73.2%
Unweighted Average:
72.3%
Median:
75.7%
Standard Deviation:
17.1%

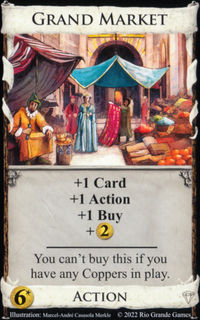
One of everything and an extra coin doesn't sound like much, and you need to jump through hoops to get it? The deal is a lot better than it sounds. Jumping through the hoops can make it slow, but it is commonly worth it.
#8 ▲1 Border Village (Hinterlands)
Weighted Average:
73.5%
Unweighted Average:
69.7%
Median:
73.0%
Standard Deviation:
14.8%

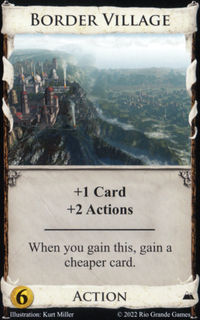
In the best case, you only pay $1 more to get a Village with your $5 cost. Or you can Remodel into Border Village. If you are able to make use of its gain effect more often than your opponent, you're in a good shape to win the game.
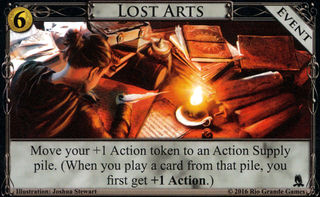
#7 ▼1 Lost Arts (Adventures)
Weighted Average:
74.6%
Unweighted Average:
72.5%
Median:
81.1%
Standard Deviation:
23.4%

Turning a cantrip into a village gives a lot of flexibility to many kingdoms. The cost of 6 should be easy to achieve around the time that a deck needs to have a bunch of villages.
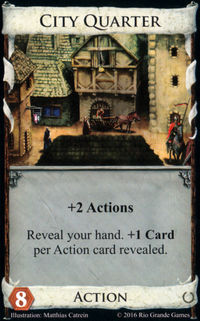
#6 ▲1 City Quarter (Empires)
Weighted Average:
77.6%
Unweighted Average:
74.4%
Median:
78.4%
Standard Deviation:
17.8%

Finding the right timing for your City Quarter gains is sometimes tricky. But in general you should get more than you think. If you also find a way to increase the action density in your hand, the deck can become quite explosive.
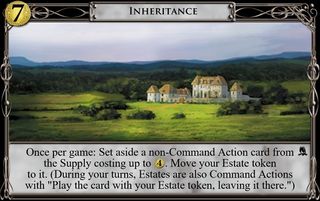
#5 ▲3 Inheritance (Adventures)
Weighted Average:
77.9%
Unweighted Average:
72.7%
Median:
78.4%
Standard Deviation:
21.0%

Cementing its place at 5th, Inheritance is obviously a very strong effect. Personally I put it a little bit lower as it is more situationally good than others it is ranking above. When the conditions are right for using it there is no doubt about its power.
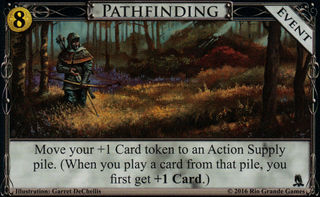
#4 =0 Pathfinding (Adventures)
Weighted Average:
78.8%
Unweighted Average:
78.1%
Median:
83.8%
Standard Deviation:
16.7%

Pathfinding keeps its spot. It is the best of the rest with a significant distance to the top 3 on this list. The +card token is great...the sooner you're able to buy it the better.
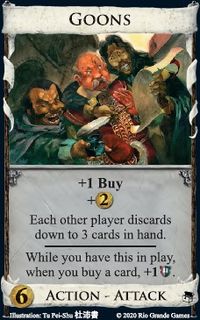
#3 =0 Goons (Prosperity)
Weighted Average:
93.5%
Unweighted Average:
90.4%
Median:
95.0%
Standard Deviation:
17.7%

I'm still enjoying playing with Goons, that could make me a masocist. A useful attack with virtual VP, economy and +buys, it is a compelling payload for any deck. The attack does not stack but the rest of the abilities are very good in multiples. With a deck willing to buy many coppers/silvers the points ceiling for such a deck is very very high. Do not ignore. Obviously this is still the region of cards people are not sleeping on.
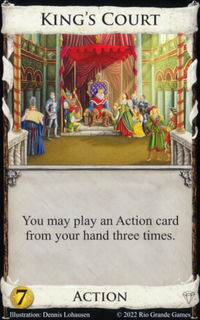
#2 =0 King's Court (Prosperity)
Weighted Average:
93.8%
Unweighted Average:
90.0%
Median:
94.6%
Standard Deviation:
19.5%

lovestha: Extremely powerful. Costing 7 is a lot, so it can be too slow. But it can play the role of village or simply amplify your payload. As it must collide with something it is probably wrong to open but otherwise it is a great card. Only clearly a trap when the kingdom doesn't support more than single provincing.

markus: Let's be clear. You almost always want it and you want it in big quantities.
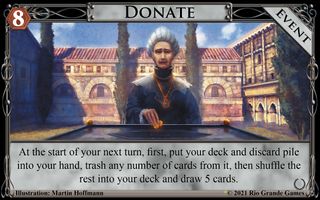
#1 =0 Donate (Empires)
Weighted Average:
97.5%
Unweighted Average:
95.2%
Median:
100.0%
Standard Deviation:
16.3%

Infinite trash for just 8 debt?! Do we really need to say more about this most powerful option? As a self confessed player I'm sure the mistakes I'm making with Donate are: Not planning when to use it well enough; Not thinking about using it twice in a game.
                     

4
Dominion General Discussion / Dominion Log Statistics
« on: September 17, 2018, 06:10:36 pm »
We’ve had some fun with that already on the Dominion Discord and I thought it was time to write up a summary.
Using ceviri’s tool woodcutter (http://ceviri.me/woodcutter/) I’ve logged games of top players played since the start of this year. Games qualified, if at least one player had skill (=mu) of at least 1.9 at the time. For all conclusions that you draw from this, keep in mind that this is really the right tail of the skill distribution (top 0.9%).
In addition, about 12% of the logged games are because of specific players that played them. I’m dropping all games that ended before turn 3 and those with more than 2 events/landmarks. The result are about 24,000 games that I use - and for which the logs can be found on Woodcutter.

The results of the log analysis can be found starting from this google sheet: https://docs.google.com/spreadsheets/d/1M2L7hcY3sbA33OwuZhgPYJWVlMFgJYBdK8cnkbJHmbo/edit#gid=0
Summary of the results can be found for each card in the form of images in this album: https://1drv.ms/a/s!AgOcGYxKWHVDnXKCXradFogAJnMu

Some caveats first: for about 5% of the games grabbing the log was not successful. Some of them might be because I lost connection, more worrisome are the ones that are not randomly dropped: Smugglers had a bug that made some of its games unloadable; when the last decision is an autoplay by the bot (primarily Changeling) it can’t be loaded; and there are some internal errors. There’s also a bug with Band of Misfits and Overlord such that it counts as the copy of the card it is when it is in play at game end – so I try to exclude those games when that matters.
A limitation of the logs is that the last decision is not recorded. That could be an innocuous “end buy phase”, but also buying the last Province.

In this post, I primarily want to describe what I did and what you can find there. There’s a lot of data so expect to find some outliers, if you start searching for them. For example, it’s intuitive that it’s good to have a 5-2 opening on a board that has Witch. That it’s good to have 5-2 on a board with Fountain is more likely to be noise.

Let’s start with the information included in the graphs, using Rebuild as an example:


There are 741 boards with Rebuild.
The first player has won 62% (more precisely, if both players had the same strength, the first player would win 62%). This is slightly higher than the 59% estimated across all boards. But the standard error of this estimate is 2.1%, so it’s not a (statistically) significant deviation from the usual first player advantage. This is an observation that I’ve made more generally: changes in first player advantage tend to be small: there is little signal relative to the noise, so don’t try to interpret too much into it - even if it makes sense that FPA should be higher on Rebuild boards. On the flipside, “little signal” means that we can be relatively sure that there are no cards which make the first player win 70% or more of the games.

What I call the “skill multiplier“ is 0.93 for Rebuild, which indicates that it favours the weaker player as it’s less than 1. The motivation for this estimate is that in theory the win probability of a player with skill difference ∆mu is given by winprob=1/(1+exp(-∆mu)). The skill multiplier is the factor that multiplies the skill difference in this formula such that the observed results on Rebuild boards are explained best:  winprob=1/(1+exp(-∆mu*skill_multiplier)). A value less than 1 means that the difference in mu between the players gets effectively shrinked – the better player wins less than they should according to their skill advantage. For example, a player with a positive ∆mu=1 (that is 7.5 levels) should win 73.1% of the games in general, but only wins 71.7%. Again, I show the standard error for this estimate showing that it’s not significantly smaller than 1. Also note that the estimated skill multiplier across all boards is 0.94, such that better players always tend to underperform a bit. (My short explanation would be that for top players their skill estimate mu is too swingy – my mu has fluctuated between 1.9 and 2.3 this year and I don’t believe that a lot of this was actual skill changes. As a result, when my mu is low after a bad streak I outperform expectations and vice versa.)

Next on the top left are the usual game endings with that card on the board. As the last decision is not logged, the classification might not always be exact, but I’m following the rules: if there’s at most 1 Province or Colony in supply it counts as Province ending; if the supply is at most 1 card (not Province or Colony) away from a three-pile ending it counts as such. All other games count as resignation. Note that some games will be classified as both Province and 3-pile ending (more than should be in reality) and some 3-piles might wrongly count as resignation (e.g. two Ports left in supply that are bought with last buy for 3-pile). Over all games there are 39% Province endings, 28% 3-piles, and 35% resignations. Governor leads to many Province and few 3-pile endings and Goons is the other way around. Tournament games have a high rate of resigns.

In the bottom panels there is the histogram with the share of games in which each player gains a certain number (left) and for the difference in the number of gains (right).
You can roughly see whether that led to more wins or losses from the colours in those bars and the top panels have the details: first, the blue coloured lines show the estimate for the win rate with a certain number of gains as well as the 95% confidence interval. For Rebuild this suggests that a player who doesn’t gain any Rebuild wins more than 50% of the games and a player with 1 Rebuild wins fewer than 50% of the games. But this might reflect that better players are more likely to skip Rebuild and they would also win more often if they go for Rebuild. To take out this effect, I estimate the version corrected for skill in green. This version uses the skill difference as an explanatory variable such that the result is an estimate for how well the players do against an equal opponent. This reduces the effect of playing without Rebuild to basically 0 (49% win rate). The right panel shows the same using the difference in gains instead of the absolute number – in the case of Rebuild there’s nothing statistically significant there.

Some gain statistics are also summarized on the top:
  • How many copies are gained on average by the first and second player (also conditional on gaining at least one)?
  • How often is at least one copy gained by one or both players?
  • How often is at least one copy gained by one or both players in the opening, which I count as everything that happens before the first player’s turn 3?
  • How often does the only player who gains it - in general or in the opening – win the game? (This is again for the raw win rate and the one that corrects for skill differences. It also includes the standard errors for the estimates.)

Some thoughts on interpreting those numbers:
  • For cards that are widely accessible (e.g. Jack of All Trades) a win rate below 50% for the only player to gain it suggests that usually the player who skips it is correct.
  • For cards that are difficult to gain because they are in limited supply (e.g. tournament Prizes) or expensive (e.g. King’s Court) a positive effect of gaining it, is not necessarily because players don’t realize the card’s strength. I would rather see it as a measure for how good it is to be the one that built the deck / got lucky to gain them.
  • Gaining Provinces or buying Salt the Earth is a direct sign that the player scores or is in a position to win the game. The reason for this would have to be found somewhere else most likely. Similarly, cards that are often gained to 3-pile for a win (e.g. Candlestick Maker) show a positive effect for the player gaining a lot of them.

Finally, let me remind you that this only uses the games of the top, and you would likely find different results for lower ranked players.

So much for the summary stats for each card. Most of the underlying information and much more can be found on the google sheets starting from here: I hope that it is more or less self-explanatory for someone who wants to dig deeper. I’ll just point out what else can be found there. First there are tabs on that sheet with stats for the whole database. Then, there are separate sheets for the different players that have a bunch of games (or were interested in them). Those are linked from the overview tab. Most useful for a general audience are:
  • better player: presenting the stats from the perspective of the player with the higher mu.
  • winner: presenting the stats from the perspective of the winner of each game.
  • 5-2 opening: limits the sample to the games in which exactly 1 player had a 5-2 opening (more precisely either drew 0 or 3 Estates/Shelters for their turn 1) and presents the stats from their perspective.

On the general sheets, there is a tab with
  • opening gains: e.g. double Ambassador was opened 17% of the times by the better player and 15% by the subsequent winner.
  • gain 1st: which card is the first one that is bought / gained / trashed a certain number of times by the better player? (Ambassador is the first card to be bought twice on 32% of Ambassador boards.)
  • gain 1st Qvist: does the same within the Qvist-cost-categories (Ambassador was the first $3-cost card to be bought twice on 40% of Ambassador boards.)
  • empty piles: has the chance of each pile in the kingdom of running out and the distribution of game end conditions.
  • gains&plays: how often is each card gained, how often are its copies played? (The better player gains 1.6 Ambassadors and plays 8.8 Ambassadors in the average game, making it 5.5 plays for each Ambassador until game end.)
  • impact factor: this was motivated by the discussion in this thread. It tries to measure how much different boards with a certain card are in terms of buying, gaining and trashing compared to the average board. For that purpose, it compares how much the probability of all other cards to be bought or the average number of cards to be bought changes. It also shows which cards are affected the most in a positive or negative way. Note that for normal card pairs only about 20 games with the combo are in the database such that the effect must be strong to show up. Nevertheless, the usual suspects for power combos do show up.
  • impacted tab shows which cards drive the impact factor the most. Intuitively, those are the cards that are most board dependent. (e.g. Peddler for number of being bought, Fortress for number of being trashed).


The individual sheets have a tab that compares the buys / gains / trashes of the named baseline player with their opponents and one tab that shows the distribution of the number of buys / gains / trashes of each card.
Then they have the “gain 1st" and “gain 1st Qvist" tabs for that player only.
The boards tab has some aggregate statistics for boards with that card: average number of turns, average number of buys / gains / trashes. Then it has the first player advantage (not a lot of effect there) and the change in the win probability for that player. For the named players and the 5-2 opener it shows how much they outperformed expectations when that card is on the board. (e.g. being the only player to open 5-2 on a Witch board gives you a 15% outperformance, that is a 65% win chance against an equal opponent with random start.) For the better player sheet this column shows the skill multiplier (whether skill difference is more or less important on those boards).

I also tried to classify cards on the better-boards sheet in terms of being village, draw, trasher, gainer (and +buy), alt-VP, attack and types of attack. The idea was to see how the presence or absence / combination of these affects the win probability. Now, you could fill threads discussing the cards, my first try was to have them at value 0, 0.5, or 1 and then round down. (if there’s only a 0.5 Village on the board like Necropolis, the board counts as not having Villages).
Finally the logged game numbers used for the sheet with the kingdoms are on the last tab.

Have fun with the numbers and let me know what else you'd like to see!

5
Dominion Online at Shuffle iT / Some Statistics on Ratings
« on: February 07, 2018, 05:27:45 pm »
For this analysis, I’m using the same data as Scavenger. (If you don’t know it, check it out!)
I’m using all rated 2-player games played until January 29th.

Rating System

I’ll mostly talk about mu, so let’s start with a quick summary of the rating system. You can find some more info also here and the links contained therein.

1) mu (µ): this is the best measure of your skill and everyone starts with mu=0. It’s a relative measure and the expected win percentage between two players mostly depends on the difference between the two players’ mu. For example, a difference of 1 corresponds to about 73% chance of winning (ties always count as half a win). Here’s a graph that shows this probability in general:


2) phi (ϕ): the second parameter measures the uncertainty around the skill mu. In 95% of the cases a player’s true skill should lie in the interval [mu-2*phi,mu+2*phi]. Players start with phi=0.75.

3) Level: the level is simply calculated as 50+7.5*(mu-2*phi). It is therefore a conservative measure of your skill as it takes the lower bound of the interval given above. That also means that players with fewer games (recently) are on average underrated in terms of their level. But you can’t sit on your high level after some (lucky) wins.

4) sigma (σ): this is a measure for the stability of your skill. Players start with sigma=0.033 and it doesn’t move much, because stability of mu is hard to estimate given the few games per rating period (=1 day). Given this assumed parameter, the skill of a typical player either gains or loses 0.033 of skill on a day. This makes the estimate of the skill less certain when a player doesn’t play (much) and phi increases.

How does the rating change?
In theory, it’s simple: mu increases, if you win more games than you were expected to. Scavenger also calculates that for you. How much mu changes also depends on your uncertainty phi. The more certain your rating is, the less it will change.
In particular, the formula is:
mu_change = phi^2*(actual_wins – expected_wins)
So, if your phi=0.2, winning or losing a game makes a difference of mu=0.04 (or level=0.3). If you were expected to win with 75%, then winning adds mu=0.01 and losing subtracts mu=0.03.

Uncertainty phi decreases with each game played and increases due to sigma. If your opponent is closer to your skill, phi will decrease more as the result is more informative (what matters is (win_probability*(1-win_probability)). If you play a constant number of games per day, your phi will converge to a certain value. (if you play less afterwards, it will increase again and vice versa.)
For example, if you play 1/5/10 games per day, phi will end up around 0.26/0.17/0.15.


Games Played

Here’s the number of those rated 2-player games recorded per day and the number of what I defined as “active players”, i.e. having played at least 10 games in the last 30 days.
Edit: the number of games in the left graph should be halved because each game is counted for each player, hence twice.

There are around 20,000 10,000 games played per day and active players are around 5,000. You can notice the reduction in games played in late October, when Nocturne preview was available.


Distribution of Skill

Here’s the histogram of the current skill of all players, only active players, and the one weighted by the number of games played (in that one mu is the value on the day the game was played:


The following heat maps show which players get matched most frequently. The right one zooms in one games with at least one player having mu=1.5:


You can see above that the distribution is not centred on mu=0 anymore, but the average is negative. Here is how the average has evolved since the start of the leaderboard:


First, let me be clear that this decline is not a big problem, because what matters is not the absolute value of mu but the difference between two players.
But what’s the reason? As described above, the change of mu depends on the difference between actual wins and expected wins and phi. The former is symmetric: if player 1 outperforms expectations, player 2 underperforms by the same amount. But phi can differ between the two. In particular, if the underperformer has a higher phi than the overperformer, mu of the underperformer will fall more than mu of the overperformer increases and average mu falls. This could happen, because new players (high phi) are doing worse than expected (mu=0) or players that have been away for some time (higher phi) are playing worse than before.

Something to note are the two breaks in the red curve of active players above: end of May the decline stopped when the matching system was changed to make the default match more even (smaller level difference allowed). The second break was end of July, when the parameters of the ratings system were changed. That increased the level of new players to 38.75 and made matches of new players with experienced positive mu players more likely.
(Note: I calculated each player’s mu from the start using the current parameters, such that there’s no break in the method. Lowering starting phi from 2 to 0.75 helped to keep average mu more stable, because new players don’t lose that much rating on their first losses anymore. If I calculated today’s ratings with the original parameters, the average would be at -0.85 for all players and -0.6 for active players.)

To round this up, here are the upper percentiles and how they have evolved:


Beat the Expectation?
If you want to increase your mu, you need to play better than expected. A question that regularly comes up is whether it’s more beneficial to play a better or weaker opponent. For that I look at the difference between expected outcome and actual outcome for different bins of level difference (I use level here, because that’s what you can set in your matching options). I restrict the sample to the better player being at least level 45. The result is the left panel of this graph:
 

It shows that a better player slightly underperforms when facing a weaker player. But the difference is hardly significant: playing someone 8 levels higher would give you a 1% better outcome than playing someone 8 levels lower. Therefore, when averaged over all players, the theoretical win probability shown in the first graph matches the outcome well. Some players might still do better when facing someone stronger or weaker.

The right graph shows the overperformance in the n-th game of a player on a given day (only using players with already 100 games). You might think that it’s harder to focus on many games in a row, but that graph doesn’t show a strong effect, either. The caveat is that I can only use the rating day, such that I can’t see whether there’s been some hours of break between games. If someone plays around 0:00 UTC, then games also count for two days.
What you can see from the right graph is that there is an outperformance on average for those players with 100+ games. That means that those players tend to increase their rating when they play. So let’s have a look at the correlation between games played and skill in the following heat map:

There is a mildly positive relationship between the total number of games played and a player’s mu. But you can also see that there’s a lot of variance and playing many games is not sufficient for becoming a good player. Hence, you might want to spend some time on the other sections of this forum or the discord channel.

6
The Best Cards (Top Half)

LaLight provides comments for odd ranks and markus for even ranks.

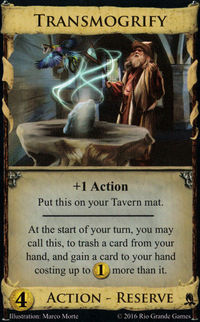
#41 ▼5 Transmogrify (Adventures)
Weighted Average:
52.9%
Unweighted Average:
54.4%
Median:
53.1%
Standard Deviation:
21.1%

Transmogrify just like Duplicate has lost some ranks in this year. In my opinion, the problem with these Reserves is to play them in advance to get some bonus much later. But what makes Transmogrify somehow a little worse is that sometimes you don’t have anything to trash after starting Estates. And of course being the Reserve and therefore being very slow hurts Transmogrify a lot.
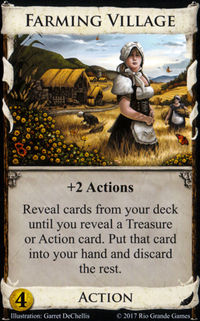
#40 ▲3 Farming Village (Cornucopia)
Weighted Average:
56.6%
Unweighted Average:
56.0%
Median:
59.3%
Standard Deviation:
16.7%

Farming Village has been stable over time in the middle of the ranking. It's a village that sometimes skips cards that you don't want to have - you're sad when it skips your Ghost.
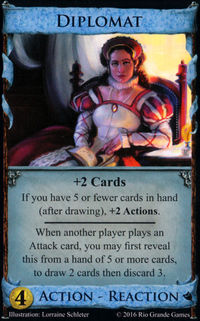
#39  Diplomat (Intrigue)
Weighted Average:
57.1%
Unweighted Average:
55.7%
Median:
51.9%
Standard Deviation:
18.1%

Diplomat is one of those cards which heavily depends on kingdom. Either the whole engine depends on presence of Diplomat or Diplomat won’t be bought for the whole game. But whatever said, Diplomat is much stronger than its predecessor, the Secret Chamber, both in Action and Reaction part.
#38 ▼2 Envoy (Promo)
Weighted Average:
58.7%
Unweighted Average:
54.5%
Median:
55.6%
Standard Deviation:
21.9%

Envoy has lost a bit and has just fallen behind Advisor.
Having to give up the (potentially) best card often does more harm than drawing one additional card compared to Smithy or its variants. It's nice if there's some other draw or sifting that ensures drawing the good cards that your opponent has discarded.
#37  Mill (Intrigue)
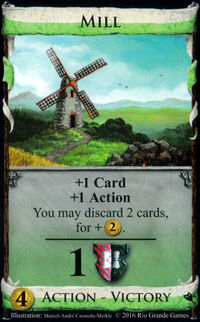
Weighted Average:
59.7%
Unweighted Average:
53.3%
Median:
54.3%
Standard Deviation:
22.2%

The next second edition card in the list, Mill. Mill is a Great Hall+, being one of the ways to hit $5 on the second shuffle almost guaranteed. Other than that it has usual perks of being 2-type cards (Ironworks/Ironmonger etc. interactions) and overall is an average card.
#36 ▼4 Ironworks (Intrigue)
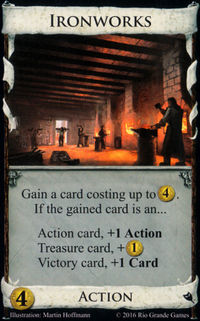
Weighted Average:
59.7%
Unweighted Average:
57.1%
Median:
56.9%
Standard Deviation:
16.0%

Ironworks loses a bit this year, bringing it closer to Armory and Engineer.
Use it, if you want to gain many cards costing up to 4, or to potentially pile-out.
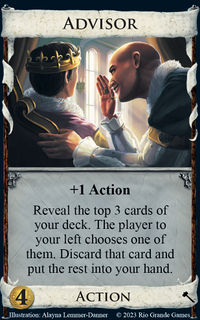
#35 ▲8 Advisor (Guilds)
Weighted Average:
59.9%
Unweighted Average:
57.8%
Median:
54.3%
Standard Deviation:
20.4%

After losing 2 ranks in the last year, Advisor gains back even 8! One person even put Advisor onto the first place (let’s look at the avatars). Advisor is a good spammable non-terminal drawcard that gets even better in the presence of many good trashers and yeah, we have a lot of those now.
#34  Exorcist (Nocturne)
Weighted Average:
60.5%
Unweighted Average:
58.1%
Median:
56.8%
Standard Deviation:
24.1%

Exorcist is a new card that (still?) has a lot of variance in the ratings. I like it, because trashing Estates for Will-o'-Wisps is very nice early on. Imp is a nice card as well, that can be drawn by Will-o'-Wisps or play them. Finally, Ghost is a strong card but getting them with Exorcist is relatively costly and slow (gold gainers go well with it). It might not always be worth it to build that much.
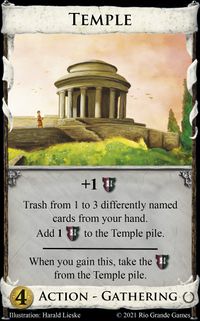
#33 ▼9 Temple (Empires)
Weighted Average:
60.8%
Unweighted Average:
60.8%
Median:
58.0%
Standard Deviation:
22.7%

The Gathering trasher from Empires has lost 9 ranks in this years, going to 33rd place. Temple is a nice self-synergetic card (play Teples, buy Temples for VP, trash Temples with Temples) but it is quite slow as a trasher compared to a whole lot of other cards. It has the very same Average, weighted and not.
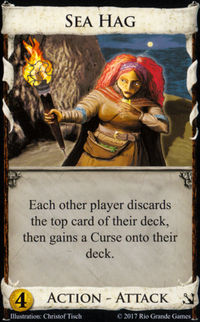
#32 ▼15 Sea Hag (Seaside)
Weighted Average:
60.9%
Unweighted Average:
62.3%
Median:
63.0%
Standard Deviation:
21.7%

Sea Hag is one of the biggest losers, dropping out of the best third.
Nowadays, there are many decent single-card trashers that can deal with the Hag's curses. And it doesn't provide any benefit other than junking, so its rank below Marauder for the first time seems justified. Still, it's a strong attack with immediate impact and I wouldn't expect her to fall much further.
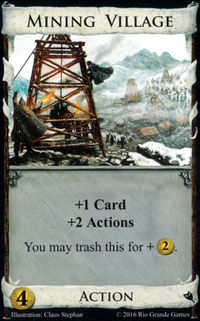
#31 ▲10 Mining Village (Intrigue)
Weighted Average:
61.0%
Unweighted Average:
56.8%
Median:
61.7%
Standard Deviation:
22.6%

Mining Village continues returning ranks to itself being whole +10 in this year! Villages get better, because there go more terminal cards and self-trashing works nice with Lurker and similar cards.
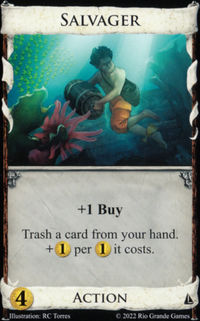
#30 ▲6 Salvager (Seaside)
Weighted Average:
61.9%
Unweighted Average:
63.4%
Median:
61.7%
Standard Deviation:
20.0%

After some losses in previous years, Salvager rises again in the rankings. Maybe opening it has become less attractive over time, but then there are more gold gainers that make it useful in the end game, as well as being able to mill Provinces.
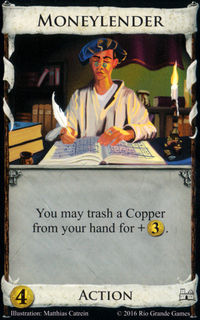
#29 ▲9 Moneylender (Base)
Weighted Average:
62.0%
Unweighted Average:
62.1%
Median:
63.0%
Standard Deviation:
20.5%

The appearance of Heirlooms haven’t ruined Moneylender’s plans to get closer to the first place! +9 ranks and this is only a beginning of his plan. Seriously though, Copper trashing is super good.
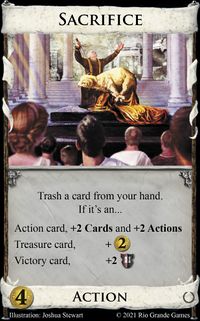
#28 ▲1 Sacrifice (Empires)
Weighted Average:
62.2%
Unweighted Average:
63.3%
Median:
64.2%
Standard Deviation:
17.9%

Sacrifice stays where it was in its second year with a relatively low standard deviation. It is a decent trasher that you often want to open with. And sometimes it's going to save your turn when you use it as a Village - or it cleans up your ruins.
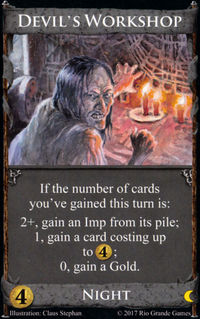
#27  Devil's Workshop (Nocturne)
Weighted Average:
62.8%
Unweighted Average:
61.6%
Median:
58.0%
Standard Deviation:
21.7%

Another Nocturne card in the list. Devil’s Workshop is quite a universal card: it can give you a Gold, if you have no money, can give you more engine pieces if you have limited gains and can give you Imps just when you need them to have a weak draw in your engine if you don’t have any.
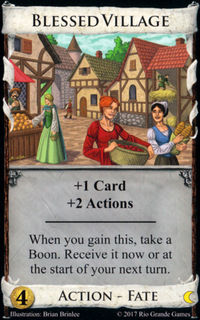
#26  Blessed Village (Nocturne)
Weighted Average:
64.5%
Unweighted Average:
60.7%
Median:
64.2%
Standard Deviation:
20.3%

Blessed Village gets its first ranking a bit outside the top quarter. I can see it rising a bit in the future. It's one of the few Villages that can already be beneficial early on.
#25 ▼17 Jack of all Trades (Hinterlands)
Weighted Average:
64.7%
Unweighted Average:
70.9%
Median:
76.3%
Standard Deviation:
20.8%

I don’t think I will be wrong if I say this is the biggest loser in the list. Minus 17 ranks compared to the last year! Sorry, Jack, but Big Money gets more and more bad with time. But in no way it is a bad card! Jack still does what he does best: protects from attacks, draws-to-X and gains Silver. It was ranked twice on the first place.
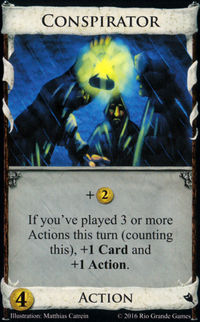
#24 ▼3 Conspirator (Intrigue)
Weighted Average:
64.9%
Unweighted Average:
67.8%
Median:
66.7%
Standard Deviation:
18.2%

Conspirator loses a few ranks this year after gaining last year. It has been pretty stable throughout. It's a very nice card if you're likely to activate it and there are probably more boards nowadays, where you can reasonably do that.
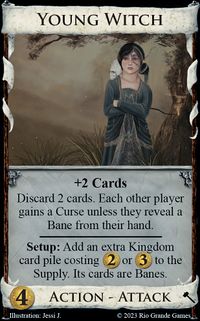
#23 ▼10 Young Witch (Cornucopia)
Weighted Average:
64.9%
Unweighted Average:
63.3%
Median:
69.1%
Standard Deviation:
22.5%

Another curser losing a lot of ranks, Young Witch. Cheap cards become better, trashing becomes better, sometimes you don’t buy YW even when there’s no more cursers on board. So Young Witch gets less and less attention (not counting Lord Rattington of course). It was ranked 1st twice.
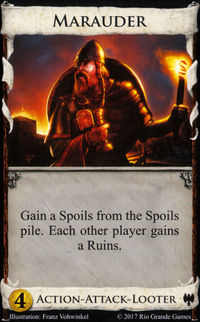
#22 ▲2 Marauder (Dark Ages)
Weighted Average:
65.2%
Unweighted Average:
62.2%
Median:
65.4%
Standard Deviation:
22.0%

Marauder gained a couple of ranks after losing the year before, so it seems to have found its place. It is now the highest junker and only Militia is a higher-rated attack. It is definitely a nice card to open.
#21 ▲9 Procession (Dark Ages)
Weighted Average:
65.4%
Unweighted Average:
59.7%
Median:
67.6%
Standard Deviation:
24.1%

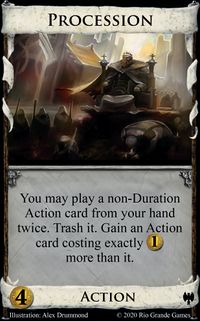
Procession is one of the best support cards in the game and one of the worst headaches for the players. It got 9 ranks compared to the last year because of its spectacular work with Durations, Reserves, cards you need for limited time (Pooka, Moneylender). And I won’t lie to say it makes the most interesting boards!
#20 ▲8 Caravan (Seaside)
Weighted Average:
65.4%
Unweighted Average:
64.7%
Median:
67.9%
Standard Deviation:
19.2%

Caravan wins the ranks that it lost the year before. Maybe Nocturne with its duration draw cards has contributed to that. Beginning-of-turn draw can be really nice for consistency, especially if there's also terminal draw on the board that you want to connect with your Villages. The well-known downside is that it misses shuffles and that you only get the benefit two turns after buying at the earliest.
#19 ▼2 Smithy (Base)
Weighted Average:
67.6%
Unweighted Average:
69.1%
Median:
74.1%
Standard Deviation:
18.0%

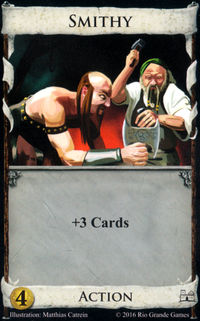
Smithy is the card that lets you draw 3 cards. You draw cards from the top of your deck, until you drew 3. Then you stop.
Seriously though, Smithy is one of the most important Dominion cards as draw is important, but lately there’s a lot of good draw other than it. So it lost a little, but still has the 19th rank.
#18  Shepherd (Nocturne)
Weighted Average:
67.6%
Unweighted Average:
65.0%
Median:
69.1%
Standard Deviation:
20.7%

Shepherd has made it to the top 20, becoming the highest-ranked Nocturne card.
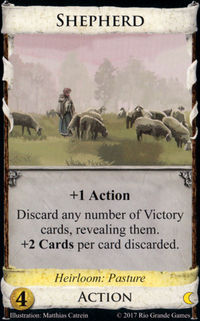
I think that's well deserved. There are surprisingly many boards that have ways to make colliding Shepherd with victory cards likely (begining of turn draw, setting aside cards, sifting). On other boards you just use it as part of your engine that makes it more reliable while greening. Pasture means that there are more Victory cards around to begin with and Estates are worth more, making it harder to ignore a Shepherd-based engine.
#17 ▲2 Quarry (Prosperity)
Weighted Average:
68.2%
Unweighted Average:
64.8%
Median:
66.7%
Standard Deviation:
18.9%

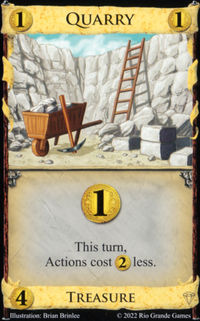
Quarry gets better as there is more Action cards in the game, so no surprises here. $4-card gainers’ rating increases, Quarry rating increases as well. + Quarry has a lot of awesome interactions, Quarry + Villa for one.
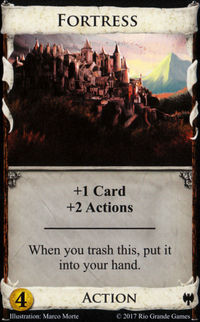
#16 ▲8 Fortress (Dark Ages)
Weighted Average:
68.7%
Unweighted Average:
65.0%
Median:
65.4%
Standard Deviation:
16.0%

Fortress gains another 8 ranks and has made it into the top 20% after starting out below average in 2013. This is in line with other Villages gaining ranks.
Often you're happy to get a plain Village for 4. On some boards with trash for benefits cards it becomes a really nice part of your payload. So watch out for those combos.
#15 ▲7 Plaza (Guilds)
Weighted Average:
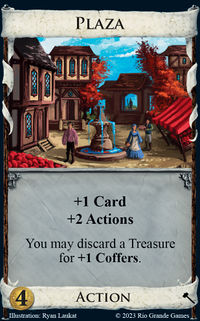
69.5%
Unweighted Average:
65.8%
Median:
69.1%
Standard Deviation:
18.0%

Another proof of Villages getting better as there are more and more engines. Plaza becomes better if you have a lot of overdraw in your deck, which is now mostly the case. Discard the Treasures, draw them back, get coin tokens!
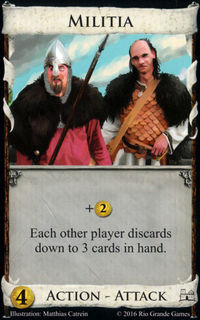
#14 ▲3 Militia (Base)
Weighted Average:
74.3%
Unweighted Average:
73.8%
Median:
77.8%
Standard Deviation:
12.7%

Militia rises a bit, undoing its loss last year. It is the strongest attack on this list. Well, you get it on most boards and often you already get it on your first shuffle.
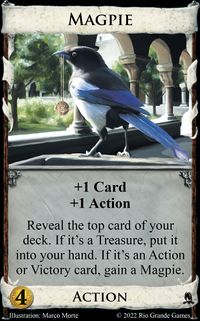
#13 ▼5 Magpie (Adventures)
Weighted Average:
75.4%
Unweighted Average:
76.1%
Median:
82.7%
Standard Deviation:
19.9%

Magpie went down 5 places since the last year and this is quite expected. As it is good to have a lot of them mostly, there’s a lot of times you’re just thinking “so? I have a lot of cantrips, thank you very much”. Still when Magpie shines, it shines a lot.
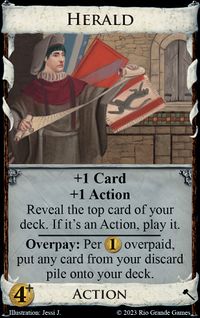
#12 ▼6 Herald (Guilds)
Weighted Average:
76.7%
Unweighted Average:
76.7%
Median:
79.0%
Standard Deviation:
15.3%

Herald's continuous rise has ended and it has dropped out of the top 10.
It is a prime target for all workshop variants as having many Heralds in a deck with a high action density is really nice. It is weaker with Night cards and with cards that care more about the order of play (e.g. Leprechaun and Legionary). It's sometimes a bit awkward with mandatory trashers.
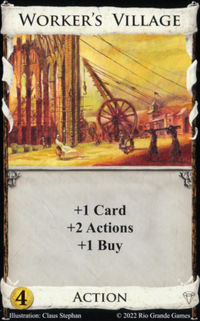
#11 ▲7 Worker's Village (Prosperity)
Weighted Average:
78.0%
Unweighted Average:
74.5%
Median:
80.3%
Standard Deviation:
17.0%

Another Village going up 7 places. This time with +Buy! This card is a lot of engine pieces in one, so expectedly it is in top.
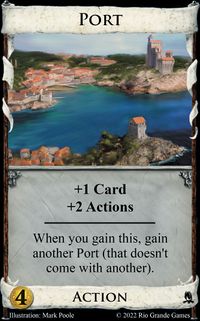
#10 ▲3 Port (Adventures)
Weighted Average:
79.3%
Unweighted Average:
76.7%
Median:
84.0%
Standard Deviation:
17.8%

Also Port gains a few ranks bringing it just into the top 10. It's two Villages almost for the price of 1 without any extra buy. If you don't care much about the extra benefits that the other Villages on this list provide, it's the best way to increase your terminal space. And you can afford to buy a couple more than usual for consistency reasons.
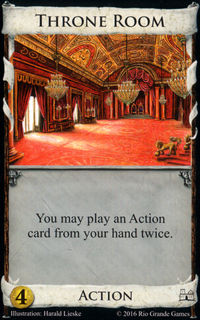
#9 ▲1 Throne Room (Base)
Weighted Average:
81.2%
Unweighted Average:
78.8%
Median:
86.4%
Standard Deviation:
19.4%

Throne Room keeps its place in Top 10, even received one place higher, especially now, when it is not mandatory.  It got 1st place twice.
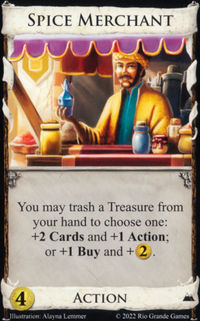
#8 ▲7 Spice Merchant (Hinterlands)
Weighted Average:
85.5%
Unweighted Average:
81.0%
Median:
88.2%
Standard Deviation:
18.1%

Spice Merchant gains impressive 7 ranks and is the second highest trasher on this list.
On the one hand, that is remarkable as it can only take care of your treasures. On the other hand, it does so in a very nice way. Often you play it as a non-terminal trasher that also cycles your deck. Then, it is not great for hitting $5 early. If that is important, it can sometimes be useful to play it for 2 coins (still not a good way to generally ensure hitting $5). And sometimes the +buy that comes with that option is what you're really looking for (and you need to find ways to not run out of fuel).
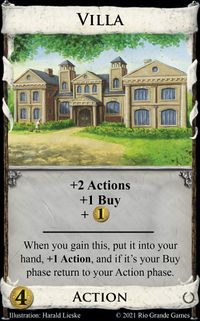
#7 ▲4 Villa (Empires)
Weighted Average:
86.9%
Unweighted Average:
80.5%
Median:
87.7%
Standard Deviation:
19.1%

Villa is in the Top 10 with +4 spots! It was ranked 4 times below average and 3 times on the first place. Outstanding card with outstanding ability.
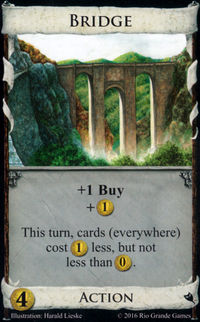
#6 ▲3 Bridge (Intrigue)
Weighted Average:
87.4%
Unweighted Average:
84.4%
Median:
90.1%
Standard Deviation:
18.0%

Bridge rises another 3 ranks this year.
There's not much room anymore, but I think it could be even higher. Many boards allow for an engine using Bridge and then it is really dominating. You want to be the first one that pulls off the mega-turn. I think that people sometimes get it too early - you often don't need to open with it. Mid-game you often want to buy more than you can play just to deny your opponent. If you win the split 7-3, you'll have good chances to eventually win the game.
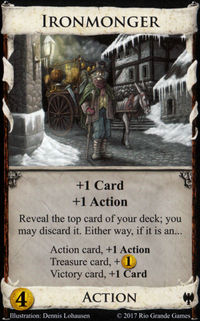
#5 =0 Ironmonger (Dark Ages)
Weighted Average:
87.6%
Unweighted Average:
82.6%
Median:
88.9%
Standard Deviation:
18.2%

Ironmonger stayed where it was with two votes below average and one first place vote. With a little nerf being Night Cards Ironmonger is still very spammable and essential in practically every game it appears.
#4  Sauna (Promo)
Weighted Average:
89.3%
Unweighted Average:
87.3%
Median:
91.4%
Standard Deviation:
12.9%

Sauna is the best new card of this list.
Together with Avanto it provides everything you need to get to 5 Provinces fairly quickly using a money-based strategy. It is relatively easy to execute and sets a high bar for competing engines - Rebuild has been considered a very strong card for a similar reason. But sometimes there is something better around and you can try an alternative strategy (if there's some faster/more reliable way of trashing). In particular, it is cumbersome for a Sauna-Avanto player to get 5 Saunas before uncovering Avantos. You might be able to do something better in the meantime and then win the Avanto split. Relying on Sauna-Avanto also doesn't allow you to build too big or add too many victory cards as you'll have troubles connecting your Saunas and Avantos.
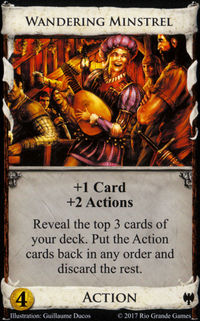
#3 =0 Wandering Minstrel (Dark Ages)
Weighted Average:
89.7%
Unweighted Average:
83.4%
Median:
93.8%
Standard Deviation:
24.0%

5 votes below average, 4 votes for the first place, it’s Wandering Minstrel! Deviation of the card is quite high and it’s understandable. Whatever said Minstrel is a high-skill card, especially with the introducing of Night Cards. But good village is still a good village and Minstrel is the best Village for $4.
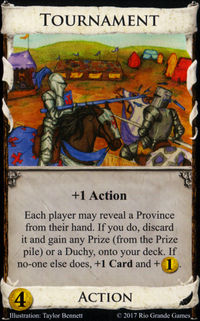
#2 =0 Tournament (Cornucopia)
Weighted Average:
91.7%
Unweighted Average:
87.9%
Median:
96.3%
Standard Deviation:
19.2%

Tournament keeps its #2 rank and has been consistently close to the top.
I'm not sure whether it deserves to be that high, in particular I disagree with the big difference relative to Poacher at #51. Of course, you almost always get it and try to get some of the 3 preferred Prizes and some Duchies maybe. That comes at the expense of building inefficiently. Also, a blocked Tournament is much worse than a Poacher that becomes an Oasis.
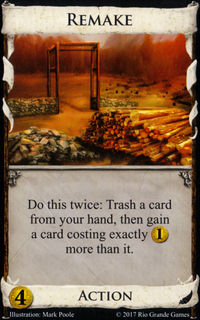
#1 =0 Remake (Cornucopia)
Weighted Average:
94.2%
Unweighted Average:
92.1%
Median:
97.5%
Standard Deviation:
11.9%

Remake remains #1 in the ranking being voted 1st 10 times. What is here to say, trashing is awesome, fast trashing is more awesome, Remake is the awesomest!

Pages: [1]

Page created in 0.251 seconds with 17 queries.